MACON, Ga. — As Georgia continues to have a statewide conversation about opening up, 13WMAZ's goal is to provide context to the numbers.
Governor Brian Kemp talked about the curve on Thursday.
It's not as simple a concept as it might sound.
At a statewide press conference Thursday afternoon, Kemp said science is guiding the state's actions.
"I have made it very clear we're going to continue to follow the data and the science behind this as we take our measured steps forward," he said.
According to Kemp, those steps forward are guided by several factors, including the percentage of positive tests versus the total number of tests given and the frequently discussed 'curve' of new cases.
"We're watching the things that we always have been," he said. "Is the curve going up? And now it's flattening and starting to go down. We're watching our hospital bed capacity. We're watching our cases of flu-like symptoms, emergency room visits."
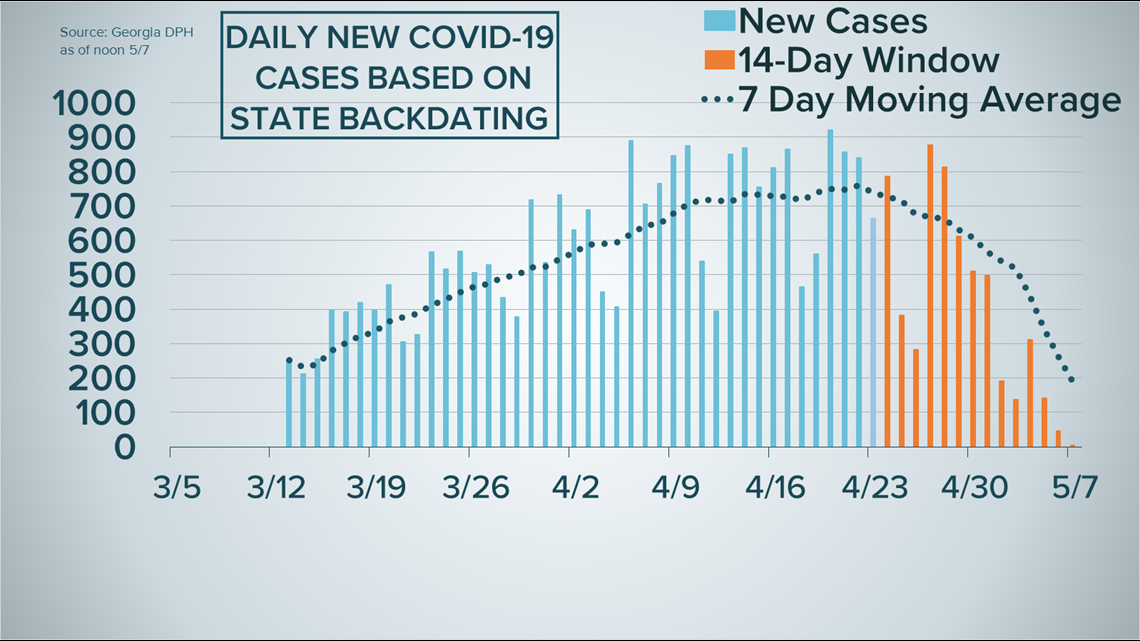
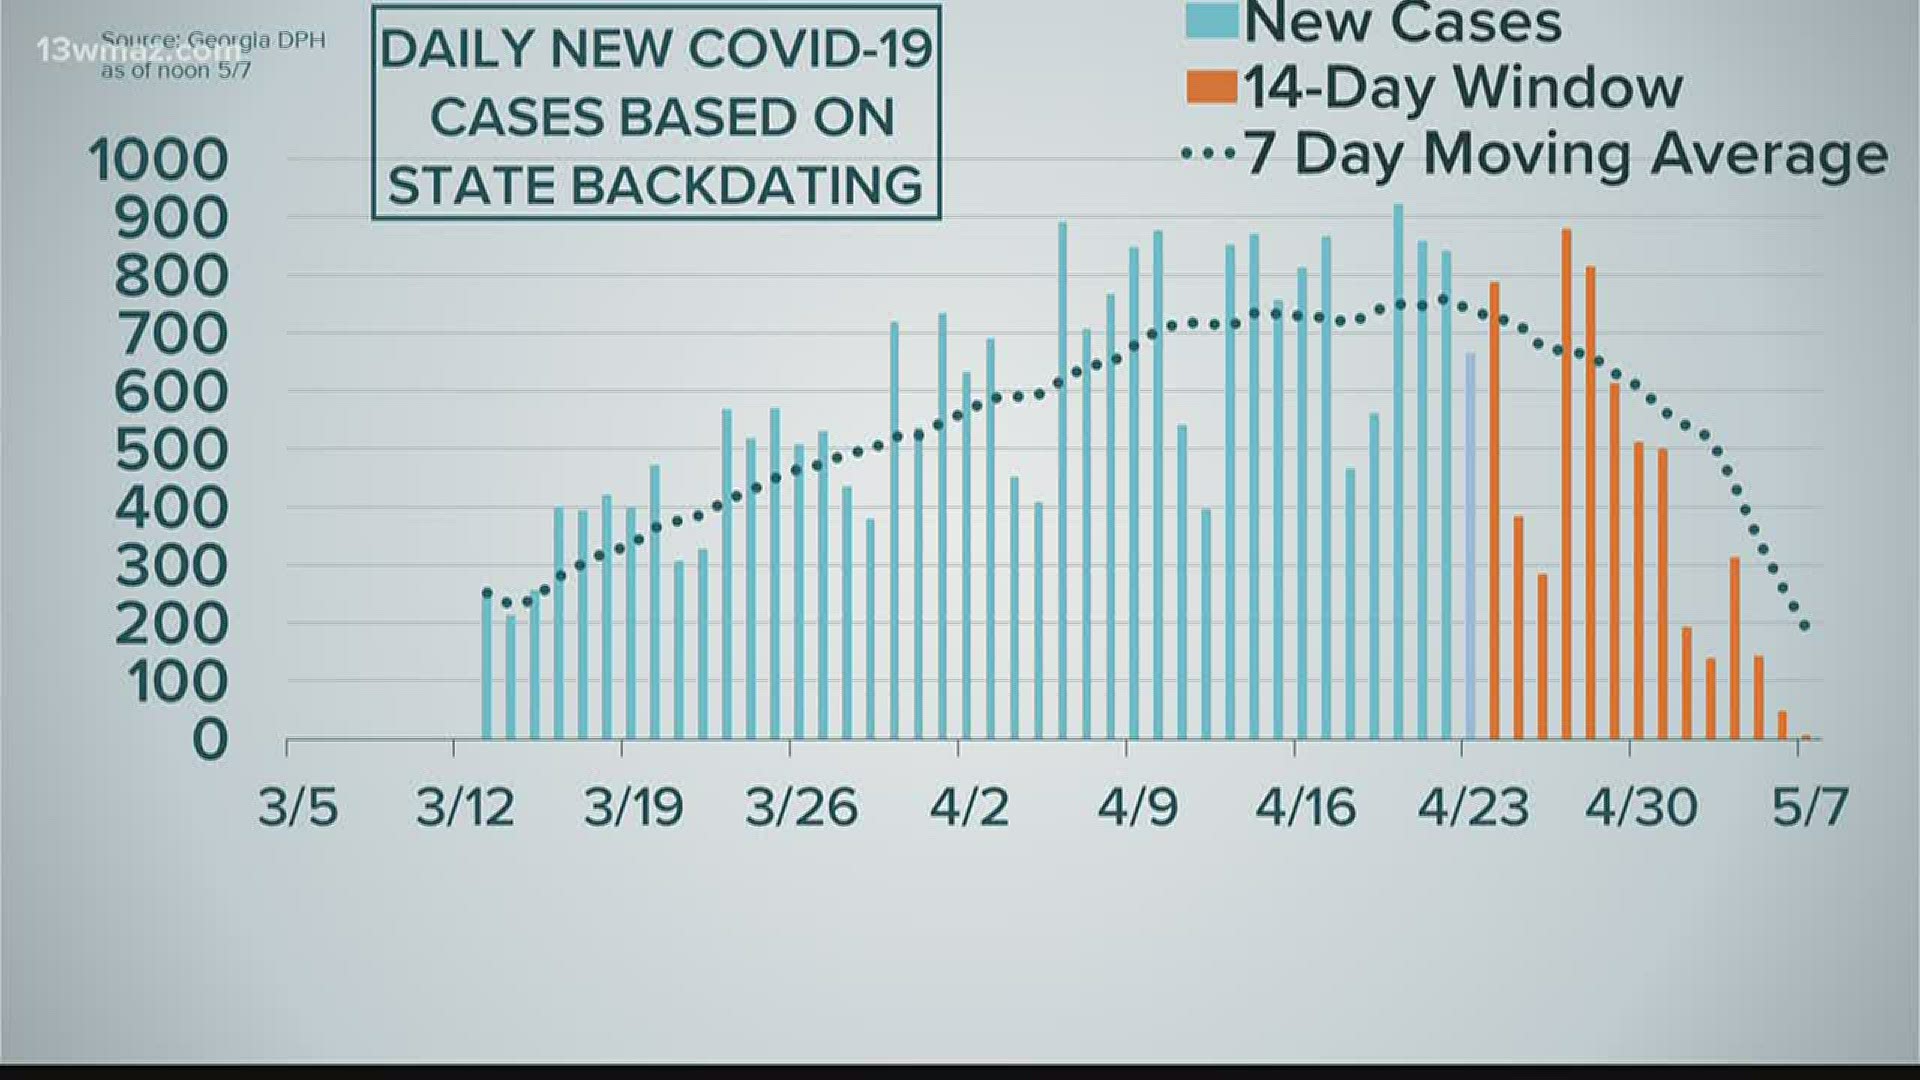
Understanding the Georgia Department of Public Health's (DPH) graph of the curve of new daily cases is tricky.
Here's what it looks like.


It seems like the trend line plummets, but that doesn't tell the whole story.
Recently, the state started backdating most cases, graphing them based not on when they're reported, but when symptoms first appeared.
So, if you get diagnosed with COVID-19 today but your symptoms started ten days ago, the state will graph your case ten days ago.
The state also warns that, based on this approach, the most recent 14-day window of data is subject to change "due to illnesses yet to be reported or test results may still be pending."
That area is marked in orange.
On Thursday at noon, the DPH said there were only 4 new cases in all of Georgia.
However, that figure will likely increase over the coming days as more cases are reported and backdated to May 7.
That's not to say the data is necessarily wrong, it's just probably incomplete in that most recent 14-day window.
WHAT OTHER PEOPLE ARE READING

