MACON, Ga. — When it comes to COVID-19 in Georgia, there's a lot of data to track and plenty of places online claiming to have the 'right' statistics.
It can all make it tough to understand what's really going on.
The question at the core of this discussion is pretty straightforward: is the curve in Georgia flattening?
Parsing the data to answer it can be tough.
It doesn't help that some of the publicly available numbers don't seem to add up.
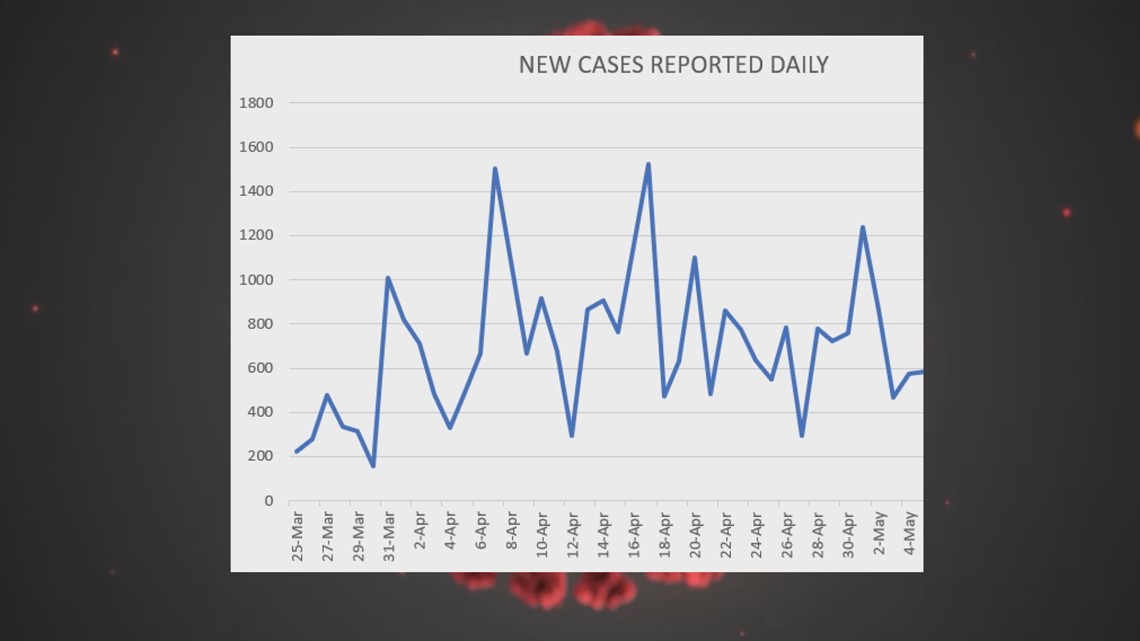
The graph below shows the number of new cases reported every day statewide by the Georgia Department of Public Health (DPH) since late March.


Nearly every data point comes from the DPH's noon online data releases. A few come from releases later in the day.
The trend line on this graph is tough to spot.
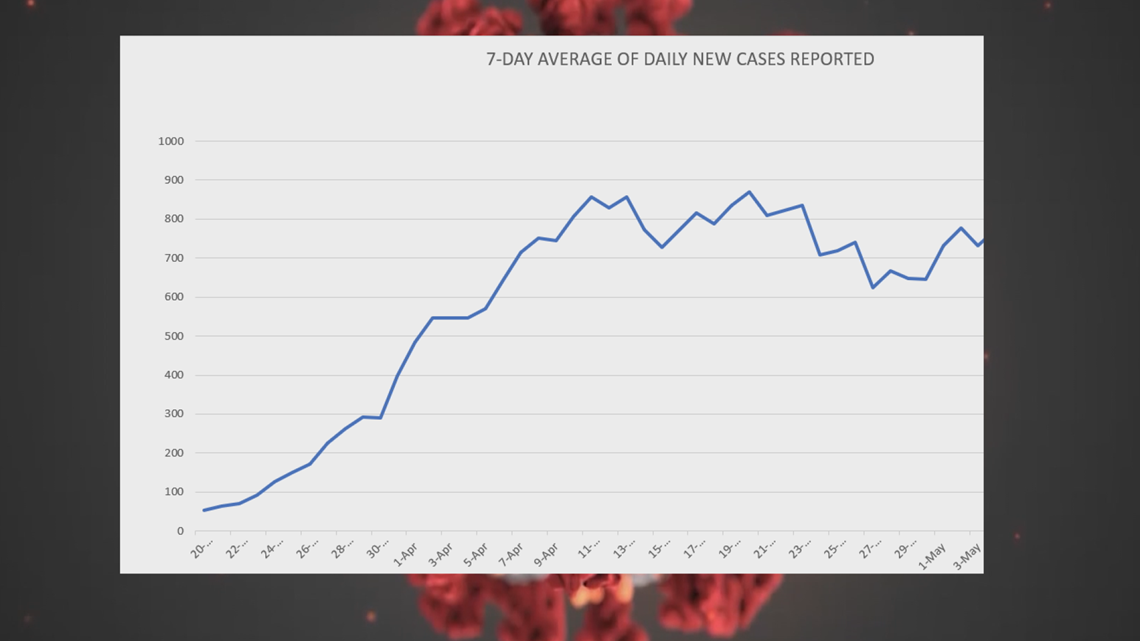
To clear it up and adjust for some of the daily variables in the DPH's reporting, let's use a seven-day simple moving average. That shows the average number of new cases added over the week leading up to any given day.


According to this data, the curve has flattened and may even be starting to trend downward.
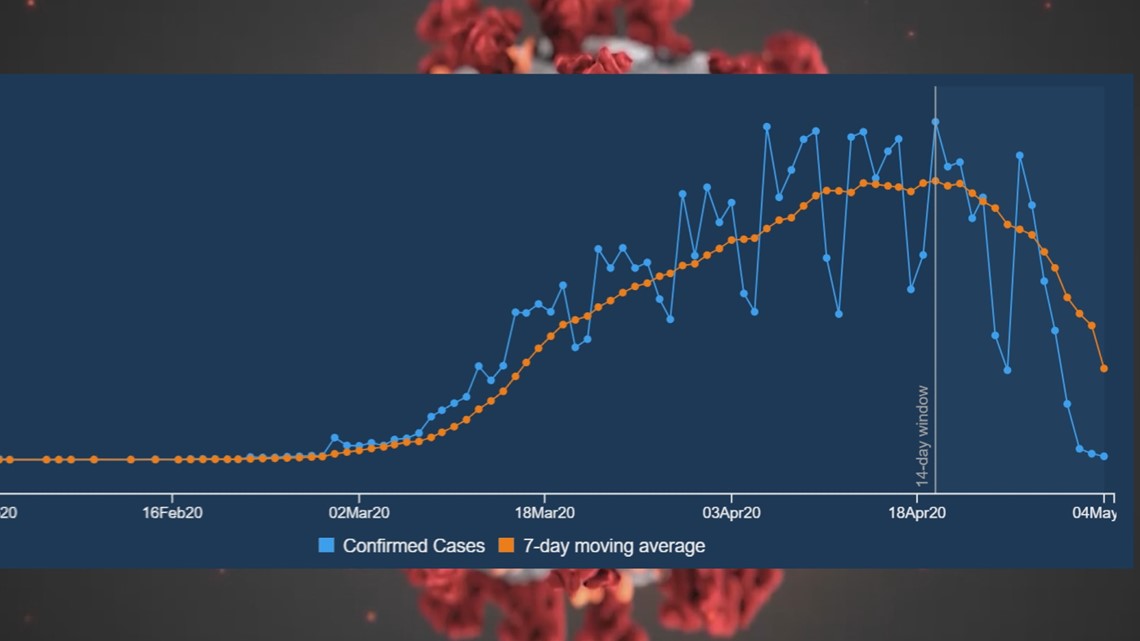
But it still looks a lot different than this graph from the state that shows a huge, recent drop in the seven-day average.


Why do they look so different?
The answer, at least in part, is in the fine print.
Our graph uses data from the DPH's daily reports of confirmed cases, graphing the tally of newly reported cases on the day they're publicly reported.
The state's graph typically dates cases not from when they're reported, but when symptoms first appear.
Here's what the state DPH reporting portal says: "The date indicated for the newly confirmed COVID-19 cases is based on the combination of dates based on:
- Date of symptom onset
- If the date is invalid or missing, the first positive collection date is used
- If both of those dates are invalid or missing, the date the case is reported is used."
So, if you get diagnosed with COVID-19 today, but began showing symptoms ten days ago, the state will put you on the graph ten days ago.
Our graph would date your case for the day it was reported.
The DPH also notes that "data during the reporting period may be incomplete due to the lag in time between when the case was tested and/or reported and submitted to the Georgia DPH for reporting purposes."
That can sound like a headache, but the bottom line appears to be this: the curve, according to data from the DPH, looks like it's flattening out and even may be trending downward.
How steep that downward trend is depends largely on how you slice the numbers.
STAY ALERT | Download our FREE app now to receive breaking news and weather alerts. You can find the app on the Apple Store and Google Play.
STAY UPDATED | Click here to subscribe to our Midday Minute newsletter and receive the latest headlines and information in your inbox every day.
Have a news tip? Email news@13wmaz.com, or visit our Facebook page.

